Database Time Monitor
Database Time Monitor is a simple standalone tool that enables you to see how “Database Time” is being used by your Oracle application. It’s designed to be as simple as possible without any dependencies. It will run against Oracle Enterprise and Standard Edition. The tool works against Oracle 11g and 10g.
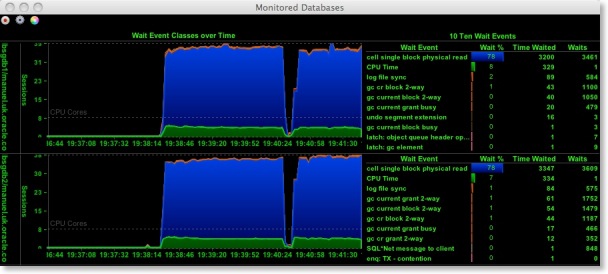
It should be regarded as a simple utility for quick analysis of how a database is running and not as a replacement for enterprise ready tools such as “Oracle Grid Control”. Users can look at one or more databases simultaneously. This is particularly useful for Oracle Real Application Clusters. The tool allows you specify the refresh rate and which database processes are monitored via its preferences (see below).
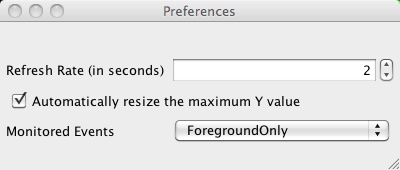
It also allows the user to record wait the wait event classes for later analysis to a comma delimited file.