SBUtil in Action (And Some Fixes)
12/03/15 18:44 Filed in: Swingbench
As a means of demonstrating what you can achieve with SBUtil I’ve created a little test to show it’s possible to trivially change the size of the data set and rerun the same workload to show how TPS can vary if the SGA/Buffer Cache is kept consistent.
First the script
I’m hoping it should be fairly obvious what the script does. I create a tablespace big enough to accommodate the final data set (In this instance 1TB). This way I’m not constantly auto extending the tablespace. Then I create a seed schema at 1GB in size. Then I run a workload against the schema, this will remain constant through all of the tests. Each of the load tests runs for 10min and collects full stats. After the test has completed I use “sbutil” to replicate the schema and simply rerun the workload writing the results to a new file. By the end of the tests and duplication the end schema has roughly ½ a Terabytes worth of data and about the same in indexes. The benefit of this approach is that it’s much quicker to expand the data than using the wizard to do it.
The directory will now contain all of the results files which can be processed trivially using the the “parse_results.py” script in utils directory. In the example below I simply parse all of the files and write the result to a file called res1.csv. Because the python script is so easy to modify you could pull out any of the stats from the file. I’m just using the ones that it collects by default
On completing this step I can use my favourite spread sheet tool to load res1.csv and take a look at the data. In this instance I’m using “Numbers” on OS X but Excel would work equally as well.
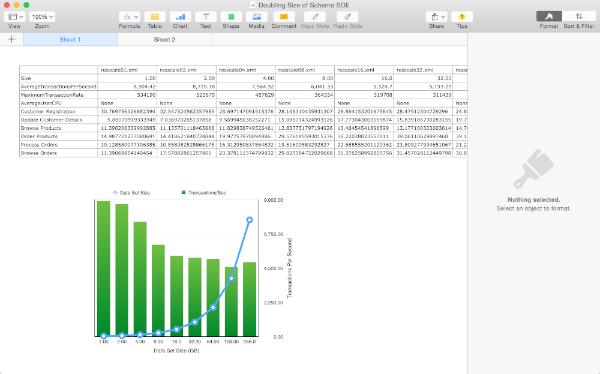
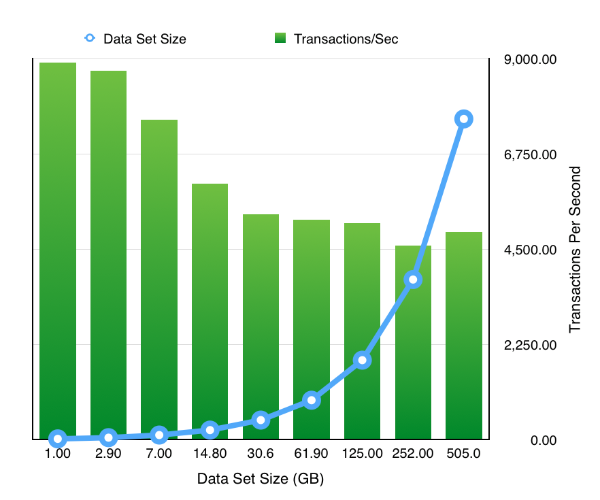
The resulting chart shows pretty much what we’d expect .That doubling the size of the datasets but keeping the workload and SGA constant results in a reduction of the TPS. Which tails off quickly as the data set quickly outgrows the buffer cache and we are forced to perform physical IOs, but declines less slowly after this impact is felt. It’s something we would expect but it’s nice to able to demonstrate it.
So the next obvious question is how easy is it to rerun the test but to enable a feature like partitioning. Really easy. Simply ask oewizard to create the schema using hash partitioning i.e. change
to
and rerun the tests to produce the following results
Or even enabling compression and partitioning by simply replacing the first sbutil operation with
During the testing of this I fixed up a few bugs which I wasn’t aware of so it’s worth downloading a new build which you can find here. I also released I needed a few more options on the utility to round it out. These were
I’ll most likely add a few more over the coming weeks.
Just a word of caution… I’ve noticed that my stats collection is broken. I don’t cater for all of the possible version/configurations in my script and so it can break on large stats collections and go serial. I’ll try and fix this next week.
First the script
#!/bin/bash

sqlplus sys/welcome1@//ed2xcomp01/DOMS as sysdba << EOF
create bigfile tablespace SOE datafile size 1000G;
exit;
EOF

time ./oewizard -scale 1 -dbap welcome1 -u soe -p soe -cl -cs //ed2xcomp01/DOMS -ts SOE -create

time ./charbench -u soe -p soe -cs //ed2xcomp01/DOMS -uc 128 -min -0 -max 0 -stats full -rt 0:10 -bs 0:01 -a -r resscale01.xml

time ./sbutil -u soe -p soe -cs //ed2xcomp01/DOMS -soe -parallel 64 -dup 2

time ./charbench -u soe -p soe -cs //ed2xcomp01/DOMS -uc 128 -min -0 -max 0 -stats full -rt 0:10 -bs 0:01 -a -r resscale02.xml

time ./sbutil -u soe -p soe -cs //ed2xcomp01/DOMS -soe -parallel 64 -dup 2

time ./charbench -u soe -p soe -cs //ed2xcomp01/DOMS -uc 128 -min -0 -max 0 -stats full -rt 0:10 -bs 0:01 -a -r resscale04.xml

time ./sbutil -u soe -p soe -cs //ed2xcomp01/DOMS -soe -parallel 64 -dup 2

time ./charbench -u soe -p soe -cs //ed2xcomp01/DOMS -uc 128 -min -0 -max 0 -stats full -rt 0:10 -bs 0:01 -a -r resscale08.xml

time ./sbutil -u soe -p soe -cs //ed2xcomp01/DOMS -soe -parallel 64 -dup 2

time ./charbench -u soe -p soe -cs //ed2xcomp01/DOMS -uc 128 -min -0 -max 0 -stats full -rt 0:10 -bs 0:01 -a -r resscale16.xml

time ./sbutil -u soe -p soe -cs //ed2xcomp01/DOMS -soe -parallel 64 -dup 2

time ./charbench -u soe -p soe -cs //ed2xcomp01/DOMS -uc 128 -min -0 -max 0 -stats full -rt 0:10 -bs 0:01 -a -r resscale32.xml

time ./sbutil -u soe -p soe -cs //ed2xcomp01/DOMS -soe -parallel 64 -dup 2

time ./charbench -u soe -p soe -cs //ed2xcomp01/DOMS -uc 128 -min -0 -max 0 -stats full -rt 0:10 -bs 0:01 -a -r resscale64.xml

time ./sbutil -u soe -p soe -cs //ed2xcomp01/DOMS -soe -parallel 64 -dup 2

time ./charbench -u soe -p soe -cs //ed2xcomp01/DOMS -uc 128 -min -0 -max 0 -stats full -rt 0:10 -bs 0:01 -a -r resscale128.xml

time ./sbutil -u soe -p soe -cs //ed2xcomp01/DOMS -soe -parallel 64 -dup 2

time ./charbench -u soe -p soe -cs //ed2xcomp01/DOMS -uc 128 -min -0 -max 0 -stats full -rt 0:10 -bs 0:01 -a -r resscale256.xml
I’m hoping it should be fairly obvious what the script does. I create a tablespace big enough to accommodate the final data set (In this instance 1TB). This way I’m not constantly auto extending the tablespace. Then I create a seed schema at 1GB in size. Then I run a workload against the schema, this will remain constant through all of the tests. Each of the load tests runs for 10min and collects full stats. After the test has completed I use “sbutil” to replicate the schema and simply rerun the workload writing the results to a new file. By the end of the tests and duplication the end schema has roughly ½ a Terabytes worth of data and about the same in indexes. The benefit of this approach is that it’s much quicker to expand the data than using the wizard to do it.
The directory will now contain all of the results files which can be processed trivially using the the “parse_results.py” script in utils directory. In the example below I simply parse all of the files and write the result to a file called res1.csv. Because the python script is so easy to modify you could pull out any of the stats from the file. I’m just using the ones that it collects by default
$ python ../utils/parse_results.py -r resscale01.xml resscale02.xml resscale04.xml resscale08.xml resscale16.xml resscale32.xml resscale64.xml resscale9128.xml resscale9256.xml -o res1.csv
On completing this step I can use my favourite spread sheet tool to load res1.csv and take a look at the data. In this instance I’m using “Numbers” on OS X but Excel would work equally as well.
The resulting chart shows pretty much what we’d expect .That doubling the size of the datasets but keeping the workload and SGA constant results in a reduction of the TPS. Which tails off quickly as the data set quickly outgrows the buffer cache and we are forced to perform physical IOs, but declines less slowly after this impact is felt. It’s something we would expect but it’s nice to able to demonstrate it.
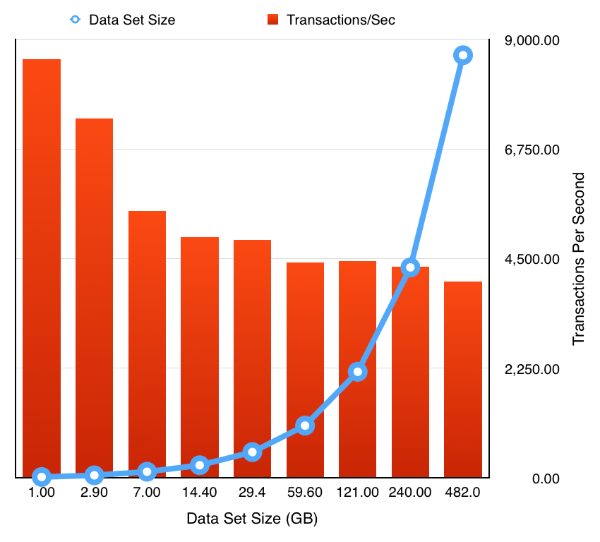
So the next obvious question is how easy is it to rerun the test but to enable a feature like partitioning. Really easy. Simply ask oewizard to create the schema using hash partitioning i.e. change
time ./oewizard -scale 1 -dbap welcome1 -u soe -p soe -cl -cs //ed2xcomp01/DOMS -ts SOE -create
to
time ./oewizard -scale 1 -hashpart -dbap welcome1 -u soe -p soe -cl -cs //ed2xcomp01/DOMS -ts SOE -create
and rerun the tests to produce the following results
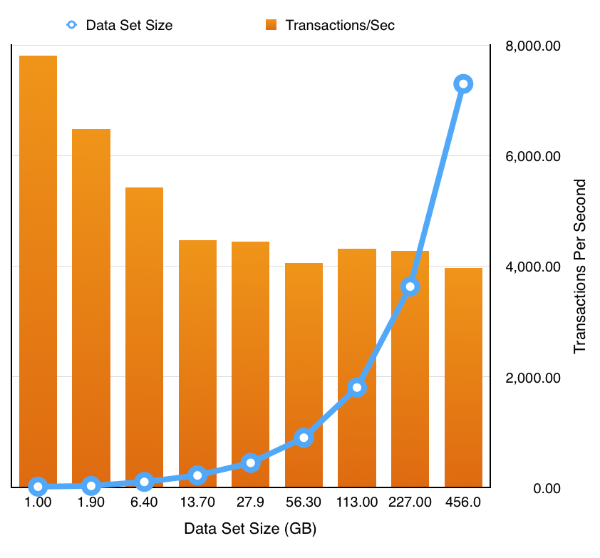
Or even enabling compression and partitioning by simply replacing the first sbutil operation with
time ./sbutil -u soe -p soe -cs //ed2xcomp01/DOMS -soe -parallel 64 -dup 2 -ac
During the testing of this I fixed up a few bugs which I wasn’t aware of so it’s worth downloading a new build which you can find here. I also released I needed a few more options on the utility to round it out. These were
- “seqs” : this recreates the sequences used by the schemas
- “code” : rebuilds any stored procedures
I’ll most likely add a few more over the coming weeks.
Just a word of caution… I’ve noticed that my stats collection is broken. I don’t cater for all of the possible version/configurations in my script and so it can break on large stats collections and go serial. I’ll try and fix this next week.
blog comments powered by Disqus